July 2023: Style your tags, compare cause & effect

We have two exciting updates to share with you!
Custom styles for tags
You can now style tags (including how you feel) to make it easier to see them when scanning your logs.
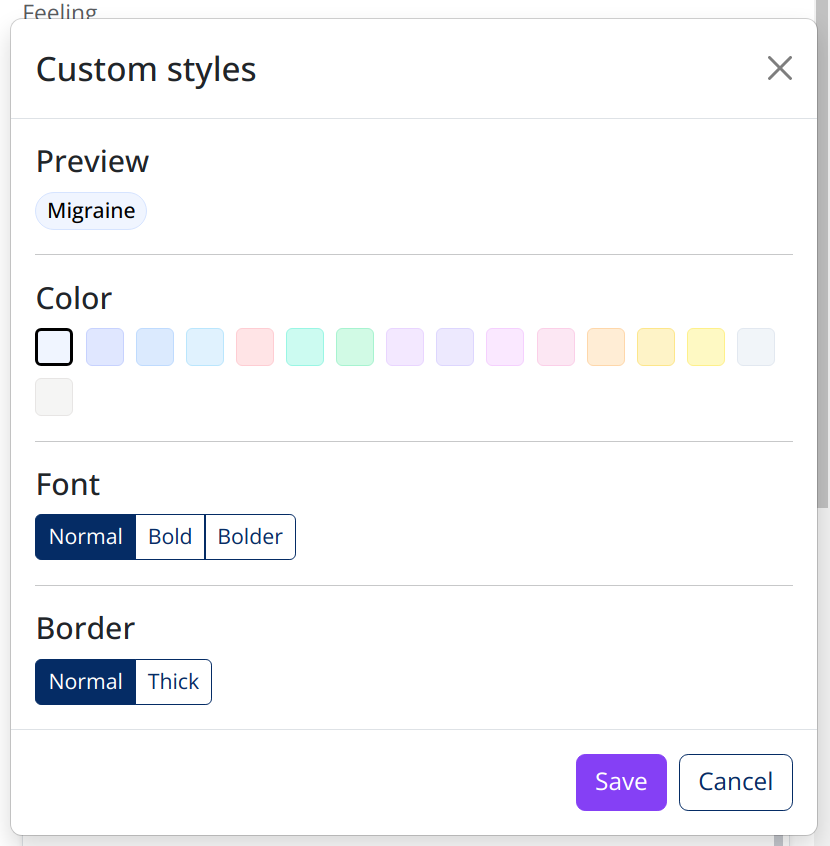
See it in action:
0:00
/0:17
Comparison chart
We are excited to announce our initial release of the comparison chart. While it's still a work in progress, we wanted to make it available so that you can provide your feedback.
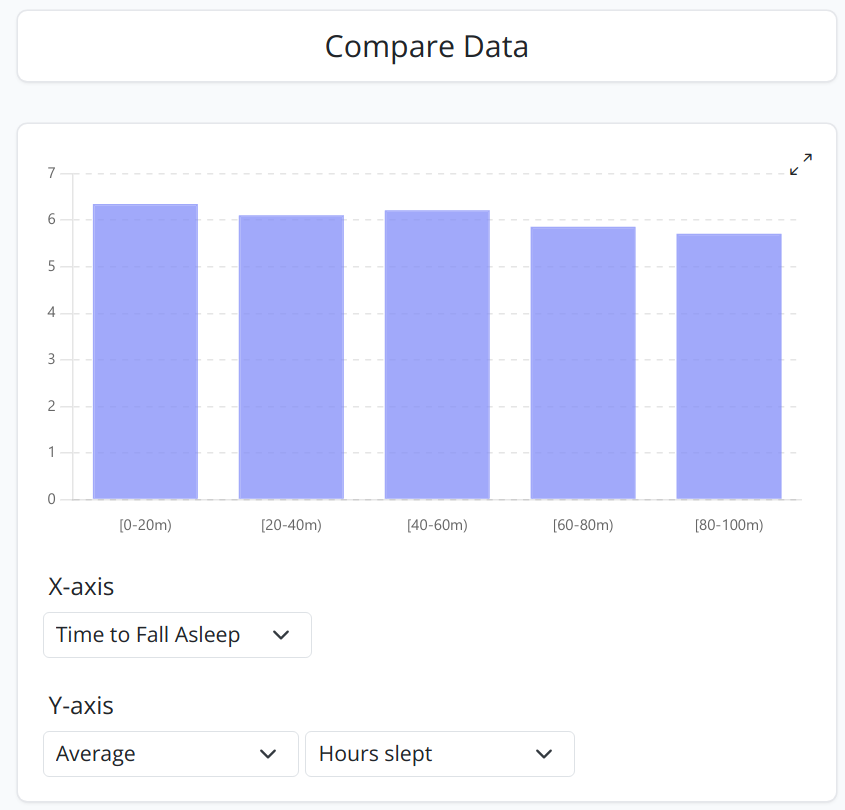
With the comparison chart, you can visualize correlations between two different variables. For example, in the screenshot above, the longer it takes me to fall asleep, the less I sleep. While this isn't that surprising, there's quite a few different values you can compare against including custom values.
We plan to continue adding more selections in the future.